• MARVLIS
    • PSAP Operations Monitor
    • NETCall
    • Fire/Rescue
    • Forecast LE
    • Brochures
    • Press Releases
    • Videos
  • Products
    • MARVLIS
    • TheAddresser
    • Esri Software & Trimble Hardware
  • Services
    • Consulting
    • Custom Development
    • Implementation
  • Mobile GIS/GPS
  • Contact Us / Support
  • About
    • In The News
    • Awards
    • Videos
    • Partners
    • Industry Links
    • Brochures
    • Press Releases
BCS, Inc.
  • MARVLIS
    • PSAP Operations Monitor
    • NETCall
    • Fire/Rescue
    • Forecast LE
    • Brochures
    • Press Releases
    • Videos
  • Products
    • MARVLIS
    • TheAddresser
    • Esri Software & Trimble Hardware
  • Services
    • Consulting
    • Custom Development
    • Implementation
  • Mobile GIS/GPS
  • Contact Us / Support
  • About
    • In The News
    • Awards
    • Videos
    • Partners
    • Industry Links
    • Brochures
    • Press Releases

PSAP Operations Monitor


"You can't manage what you don't monitor."
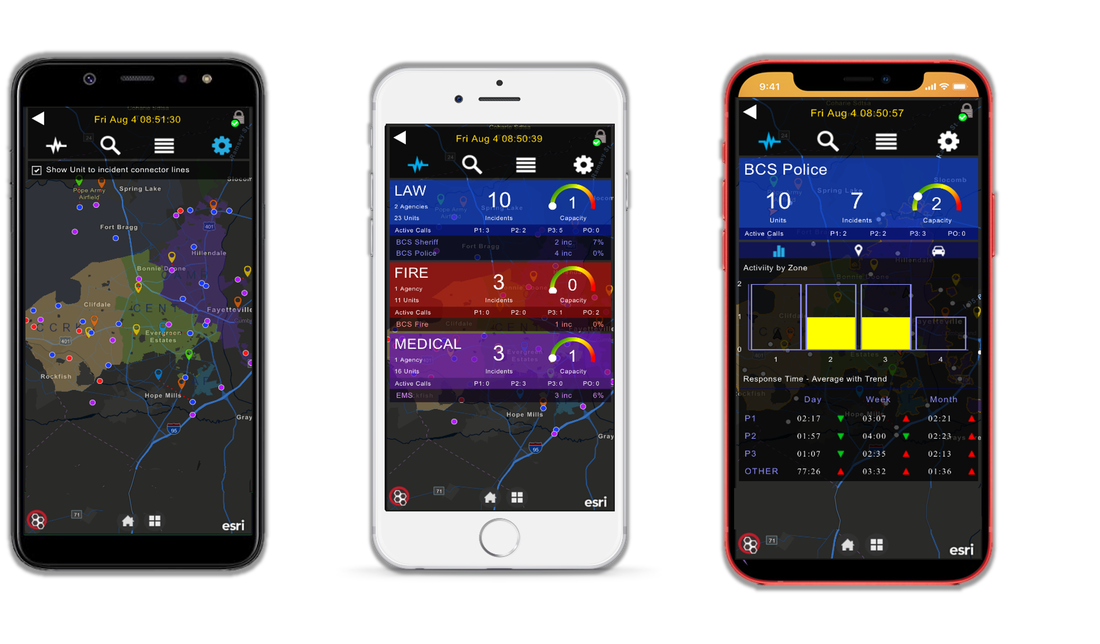
In any operation, there are important things that are difficult to measure, but easy to understand when presented in the right way. It is critical that management – at all levels – has an informed view into the key operational aspects that ensure your efficiency, safety, and quality targets are being met. As a service-based industry, public safety supervisors need to know exactly what is happening where, and to understand how those dynamics will impact your ability on each upcoming response. MARVLIS PSAP Monitor fills the role as a live operational overview providing raw statistics in real-time for managing complex, multi-agency systems as well as coordinating individual responses because the best way to impact next month’s reports is to manage them properly while those events are still happening.

At its core, PSAP Monitor is a multi-function web interface for understanding CAD data within the context of other authoritative data sources. MARVLIS Server data comprised of incidents and units from a live CAD feed are combined with contextual map layers served from your own agency ArcGIS Enterprise, or other external web map sources, to provide a complete picture of your overall operations, even across independent agencies, down to detailed individual response views.
Picture
“Actionable information in real-time.” 
User Access. This single web interface is designed for multiple user-types including executives, administration, operational supervisors, and incident command staff. Specifically, it provides executive oversight of operations by quickly monitoring response time statistics, unit availability, current incidents, and vehicle status across the fleet through secure access from any web-enabled device.

​For administrators, it offers detailed information prior to regular reporting, enabling corrective actions in real-time. Operational supervisors have immediate insight into specific crews and incidents to provide guidance and oversight of operations. At the incident command level, PSAP Monitor can provide hyper-local data on facility access or pre-planned response guidance within a larger regional context. This keeps an operational view across the affected area showing changing weather or traffic conditions including mutual aid assets from adjoining jurisdictions.
Picture
Individual Customization. The PSAP Monitor design is based on extensive experience working with high performing agencies that require an easily accessed and understood executive-style view of overall system performance. Individual logins provide quick access and defined control to a personally configured map display combining Esri ArcGIS Online base maps and services with agency GIS layers. It also incorporates real-time data streams such as:

  • live traffic conditions
  • weather radar
  • weather watches or warnings
  • earthquake occurrences
​Many other dynamic data sources can also be georeferenced for display and symbolized by current status such as the level of stream gauges or hospital diversion requests. Where live camera feeds or other streaming web services are available, these services can be accessed through selectable, georeferenced icons. A growing list of BCS service partnerships makes it possible to display points of interest within apartment or military complexes as well as college campuses or nursing homes direct from One Hundred Feet or icons related to operational pre-plans you’ve developed for institutional or residential structures through the First Due application.  

​Additionally, the interface is designed with system configurable gauges to summarize basic fleet metrics by agency as key-performance indicators in a collapsible, cell phone-sized panel showing active calls by priority and boundary (district/zone), available units per boundary, and average (or 90th percentile) response times by priority type on a daily, weekly, and monthly basis. Live vehicle positions are symbolized according to the unit status and graphically track incident assignments prior to arrival. The interactive interface allows users to select a particular unit to zoom and track that vehicle. Active calls are ordered by boundary, priority, and time received and clicking on a call item shows the call location, details, time stamps, assigned units, and CAD notes ordered by the time they are entered.  ​
Picture
System Requirements. MARVLIS Server is required as a common interface to each CAD software installation to provide connectivity for PSAP Monitor to display native CAD data, which includes current AVL and incident information. Additionally, PSAP Monitor requires an ArcGIS Enterprise license, or appropriate ArcGIS Online licensing, to provide supporting map layers and services. MARVLIS Server can optionally integrate with MARVLIS Central by sharing generalized unit statuses, positions, or incidents to facilitate the sharing of mutual aid resources with adjoining agencies. 
Picture
Summary. PSAP Monitor provides a secure, live web-based administrative viewer of the current system operating status controlled by individual logins. The configurable map display combines Esri map services from either ArcGIS Online or your own pre-existing ArcGIS Enterprise to deliver agency GIS layers and incorporate real-time data streaming services. Gauges in the user interface summarize basic fleet metrics showing active calls by priority, available units per boundary area, and average or 90th percentile response times by priority type on a daily, weekly, and monthly basis. Live vehicle positions are color-coded according to the unit status and are graphically connected to incident assignments. Any mobile units of a department with an AVL feed to MARVLIS can be tracked on the interactive display even if it is not otherwise deployed with MARVLIS. Selecting a particular unit will automatically zoom to and track that unit as it is moving. Active calls are ordered by boundary/priority/time received for any department with a MARVLIS feed. Clicking on an active call item shows the call location, details, time stamps, assigned units, and CAD notes ordered by time entered.

Click ​here to learn more about how PSAP Operations Manager can help you!

Picture
For more information, please contact:
803-641-0960 or 
Click here to email our sales team.

Ph: 803.641.0960

Fax: 803.641.1919

2170 Woodside Executive Ct., Aiken, SC 29803

Picture
Picture
Picture
Picture

Legal | Privacy
Esri and the Esri Logo are licensed trademarks of Environmental Systems Research Institute, Inc.
  • MARVLIS
    • PSAP Operations Monitor
    • NETCall
    • Fire/Rescue
    • Forecast LE
    • Brochures
    • Press Releases
    • Videos
  • Products
    • MARVLIS
    • TheAddresser
    • Esri Software & Trimble Hardware
  • Services
    • Consulting
    • Custom Development
    • Implementation
  • Mobile GIS/GPS
  • Contact Us / Support
  • About
    • In The News
    • Awards
    • Videos
    • Partners
    • Industry Links
    • Brochures
    • Press Releases